Benchmark report · Q3 2026
UGC and shoppable video in 2026: the numbers worth trusting.
The UGC statistics everyone quotes, lined up against what we measured on real stores: a split test with 30,000+ visitors per arm, ten months of GA4-attributed revenue and a PageSpeed run you can repeat. Every number says where it came from.

27 September 2026 · 9 min read
How to read the numbers
In this article
Most UGC statistics online are vendor numbers with the method stripped off. That is not a reason to ignore them, it is a reason to label them. This report puts the most-cited industry figures next to the numbers Idukki measured itself, and marks every one: navy badges are Idukki data, outline badges name the outside study.
The 2026 benchmarks at a glance
Four numbers carry most of the argument. Two come from large industry datasets, two from Idukki's own measurements.
Engager conversion lift
+161%
Shoppers who interact with UGC, against shoppers who do not
Yotpo analysis of 200k+ stores and 163M orders. An engager comparison, not a split test.
Split-test conversion lift
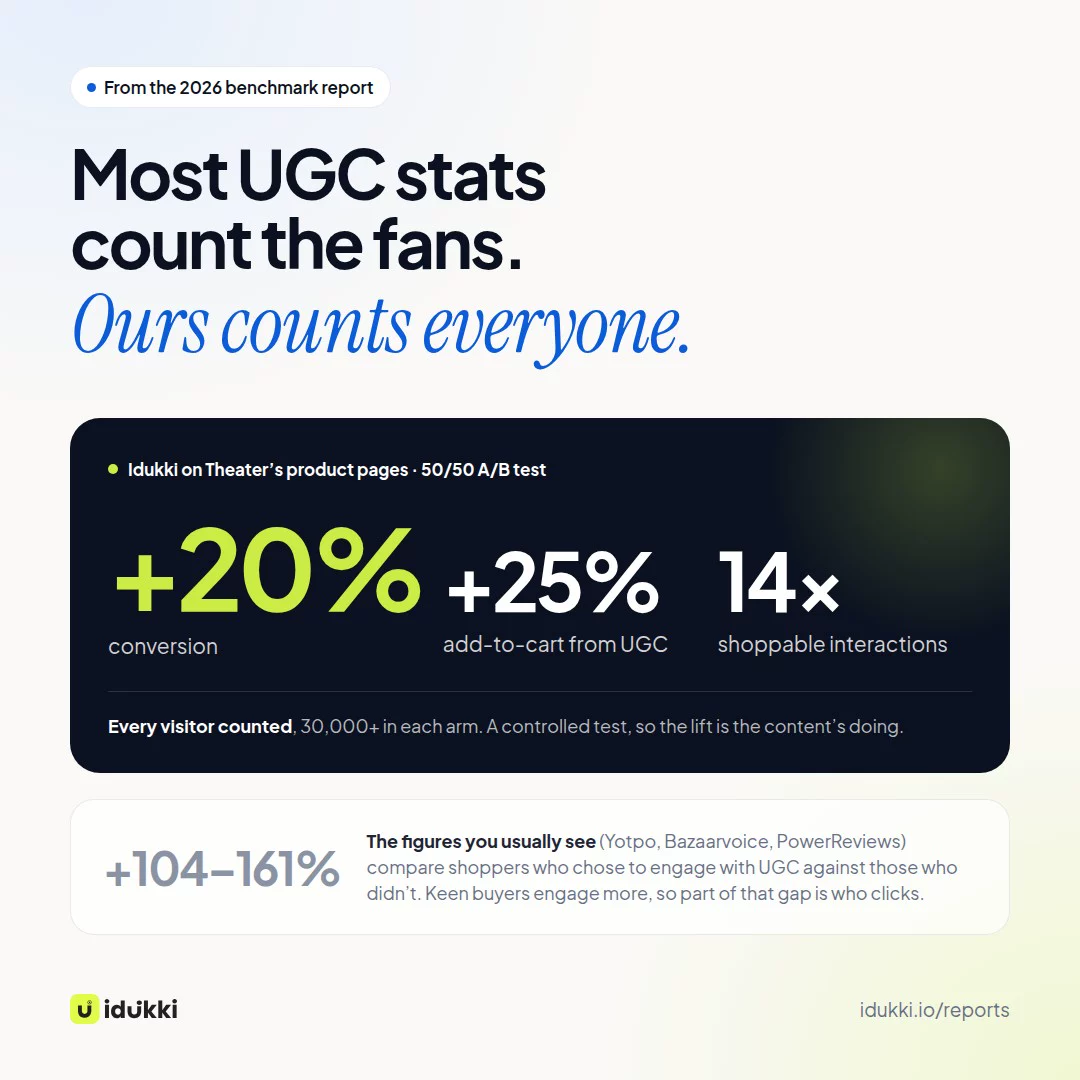
+20%
Product pages with shoppable customer content, against studio-only pages
50/50 A/B test on Theater's product pages, 30,000+ visitors per arm. Add-to-cart rose 25%.
Video vs. text reviews
4.1×
Conversion of video reviews against text-only reviews
PowerReviews, 2023 baseline. Photo reviews convert at 2.6×.
Page speed with the widget live
0.9 s
Largest Contentful Paint on a page running an Idukki gallery
PageSpeed Insights, desktop, 12 June 2026. Performance 99, CLS 0, total blocking time 0 ms.
Two kinds of lift, eight times apart
The industry numbers and the A/B number are not in conflict. They answer different questions, and the difference is the most useful thing in this report.
An engager comparison splits one audience into shoppers who touched the UGC and shoppers who did not, then compares their conversion rates. The people who open a gallery or play a video were already more interested, so some of the gap existed before the content did anything. Yotpo's 161%, Bazaarvoice's 144% and PowerReviews' 103.9% are measured this way.
A split test sends half the traffic to pages with the content and half to pages without, then compares the two halves as wholes. Nothing about the shopper decides which half they land in, so the difference is the content's own effect. Theater's +20% comes from this design.
Conversion lift, by how it was measured
Engager comparisons in gray, the whole-arm split test in blue
- Yotpo: shoppers who interact with UGC+161%Yotpo: shoppers who interact with UGC: +161%
Engager vs. non-engager, 200k+ stores · Source: Yotpo - Bazaarvoice: shoppers who engage with reviews+144%Bazaarvoice: shoppers who engage with reviews: +144%
Engager vs. non-engager, Shopper Experience Index · Source: Bazaarvoice - PowerReviews: visitors who interact with photo or video UGC+103.9%PowerReviews: visitors who interact with photo or video UGC: +103.9%
Engager vs. non-engager, 2023 · Source: PowerReviews - Theater: every visitor in each A/B arm+20%Theater: every visitor in each A/B arm: +20%
50/50 split test, 30,000+ visitors per arm · Idukki data: Theater A/B test
Different designs, so read the gap rather than a ranking. The engager figures include the effect of who chooses to engage; the split test does not.
Show as a table
| Measure | Value | Source |
|---|---|---|
| Yotpo: shoppers who interact with UGC | +161% | Yotpo |
| Bazaarvoice: shoppers who engage with reviews | +144% | Bazaarvoice |
| PowerReviews: visitors who interact with photo or video UGC | +103.9% | PowerReviews |
| Theater: every visitor in each A/B arm | +20% | Theater A/B test |
Format: video and photos outpull text
Within reviews, the richer the format, the stronger the pull. PowerReviews measured it directly, comparing conversion for reviews with photos or video against text-only reviews.
Review conversion, relative to text-only
Text-only reviews = 1×
- Text-only reviews1×
- Reviews with photos2.6×
- Reviews with video4.1×
2023 edition, treated as a baseline until PowerReviews publishes a newer one.
Show as a table
| Measure | Value | Source |
|---|---|---|
| Text-only reviews | 1× | PowerReviews |
| Reviews with photos | 2.6× | PowerReviews |
| Reviews with video | 4.1× | PowerReviews |
137%
more likely to buy after seeing customer photos
Yotpo, 200k+ stores / 163M orders
85%
say a video has convinced them to buy
Wyzowl, State of Video Marketing 2026
92%
trust recommendations from people they know above other advertising
Nielsen, Global Trust in Advertising
This is where shoppable video earns its place on a product page. It is the video format, with the product one tap from the cart instead of a scroll away.
What we measured on real stores
Two Idukki customers agreed to publish their numbers. Everything below is on their case-study pages, with the method alongside.
| Customer | Measure | Result | How it was measured |
|---|---|---|---|
| Theater, fashion | Conversion | +20% | 50/50 A/B test, 30,000+ visitors per arm |
| Theater | Add-to-cart from UGC widgets | +25% | Same A/B test |
| Theater | Shoppable-section interactions | 14× | Variant against control, same test |
| Theater | Widget impressions | 5M+ | Over four months |
| Leroy Merlin, home and DIY | Attributed gross sales | $651K | 10 months, Leroy Merlin GA4 (11.3M ZAR) |
| Leroy Merlin | Customer photos and videos collected | 1,900+ | 18 months: QR code, post-purchase email, PDP upload |
By surfacing real people using and styling our products, we significantly improved conversions on PDPs and across the marketing funnel.
Gurbir, Head of Ecommerce, Theater
Across the wider platform, Idukki runs on 140+ stores on 4 continents and serves 5M+ UGC views a month (self-reported, September 2026). We do not yet publish pooled conversion numbers across those stores. That needs each merchant's consent and a common test design, and it is what the next edition of this report is for.
Speed: the cost you should not have to pay
A widget that slows the page can take back what the content adds, so we measure ours and publish the run rather than a claim.
99
PageSpeed performance score
Desktop
0.9 s
Largest Contentful Paint
Same run
0
Cumulative Layout Shift
Same run
37 KB
widget runtime
Idukki gallery script
The run is public. Open it in PageSpeed Insights and you will get today's number rather than ours from June.
The ROI math, worked through
Here is what Theater's measured lift would mean for a store with $500,000 in monthly revenue and a 2% conversion rate, holding traffic and order value flat. Treat it as arithmetic on one test, not a forecast. Your categories, traffic and content will move the result, which is why a split test on your own pages comes first.
| Line | Value |
|---|---|
| Monthly store revenue | $500,000 |
| Baseline conversion rate | 2.0% |
| Conversion rate at +20% | 2.4% |
| Extra revenue per month | +$100,000 |
| Extra revenue per year | +$1.2M |
How to measure it properly
The benchmarks only help if you measure the same way. These are the checks we run with customers, in order.
- 1Split the traffic. Run a 50/50 test on the pages carrying UGC, against the same pages without it.
- 2Compare arms, not audiences. Report conversion for each whole arm, never engagers against non-engagers.
- 3Wait for enough visitors. Theater's test ran to 30,000+ visitors per arm before the result was called.
- 4Track add-to-cart from the widget on its own line. It shows whether the content is doing commerce work before orders catch up.
- 5Keep clicks and sales apart. A checkout click-through is a signal, not a sale. Reconcile orders in GA4 or your store analytics before reporting revenue.
About this report
Industry figures are quoted from the studies listed below, using their own methods; we have not re-run them. Idukki figures come from two named customers who agreed to publish (Theater, a 50/50 A/B test; Leroy Merlin, GA4-attributed revenue) and from a PageSpeed Insights run on a live Idukki widget on 12 June 2026. Platform scale is self-reported by Idukki. No figure in this report is a composite or an estimate, and the one worked example is labelled as arithmetic.
FAQs
What is a good conversion lift from UGC?
Measured with a split test, expect a lift in the tens of percent rather than the hundreds: Theater's A/B test measured +20% conversion and +25% add-to-cart. The 104% to 161% figures quoted across the industry compare engaged shoppers with everyone else, which overstates the effect of the content itself.
Why are the industry numbers so much higher than the A/B result?
They measure a different thing. Shoppers who choose to open a gallery or play a video were already more likely to buy, so comparing them with shoppers who did not mixes the content's effect with the shopper's intent. A split test assigns traffic at random and compares whole arms, which isolates the content.
Is video worth it over photos?
In PowerReviews' data, reviews with video converted at 4.1× text-only reviews and reviews with photos at 2.6×. Both beat text; video pulled harder.
Does a UGC widget slow the page down?
It can. Idukki's widget runtime is 37 KB, and on the PageSpeed Insights run linked in this report it scored 99 for desktop performance with a 0.9 s LCP and zero layout shift.
Can I use these figures in my own deck?
Yes, with the source. Cite the original study for industry figures and this report for the Idukki ones.
Sources
- 1Yotpo, UGC and conversion (200k+ stores, 163M orders)
- 2Bazaarvoice, Shopper Experience Index
- 3PowerReviews, How UGC Impacts Conversion (2023)
- 4Wyzowl, State of Video Marketing 2026
- 5Nielsen, Global Trust in Advertising
- 6Idukki case study: Theater (A/B test)
- 7Idukki case study: Leroy Merlin (GA4 revenue)
- 8PageSpeed Insights run on a live Idukki widget
Take the report with you.
The full report as a PDF, with every chart, table and source link, for your next planning meeting.
- The 2026 benchmarks at a glance, each labelled Idukki data or industry
- Two kinds of lift: engager comparisons against a split test
- Video and photo against text reviews
- Case-study results with the method alongside
- The ROI arithmetic and a five-step measurement checklist